Simulation 6 Base break down
Changes
I made some significant changes since the last run. The fitness function has been changed to account for organism symmetry, hopefully better age and size normalization.
Results
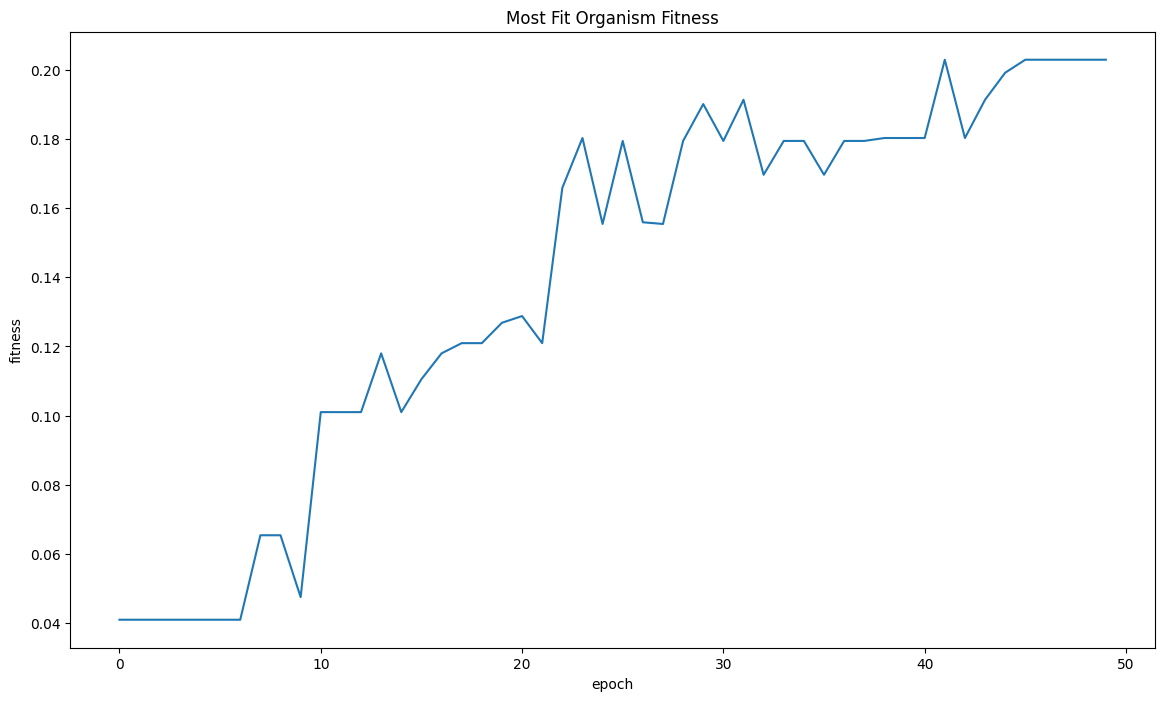
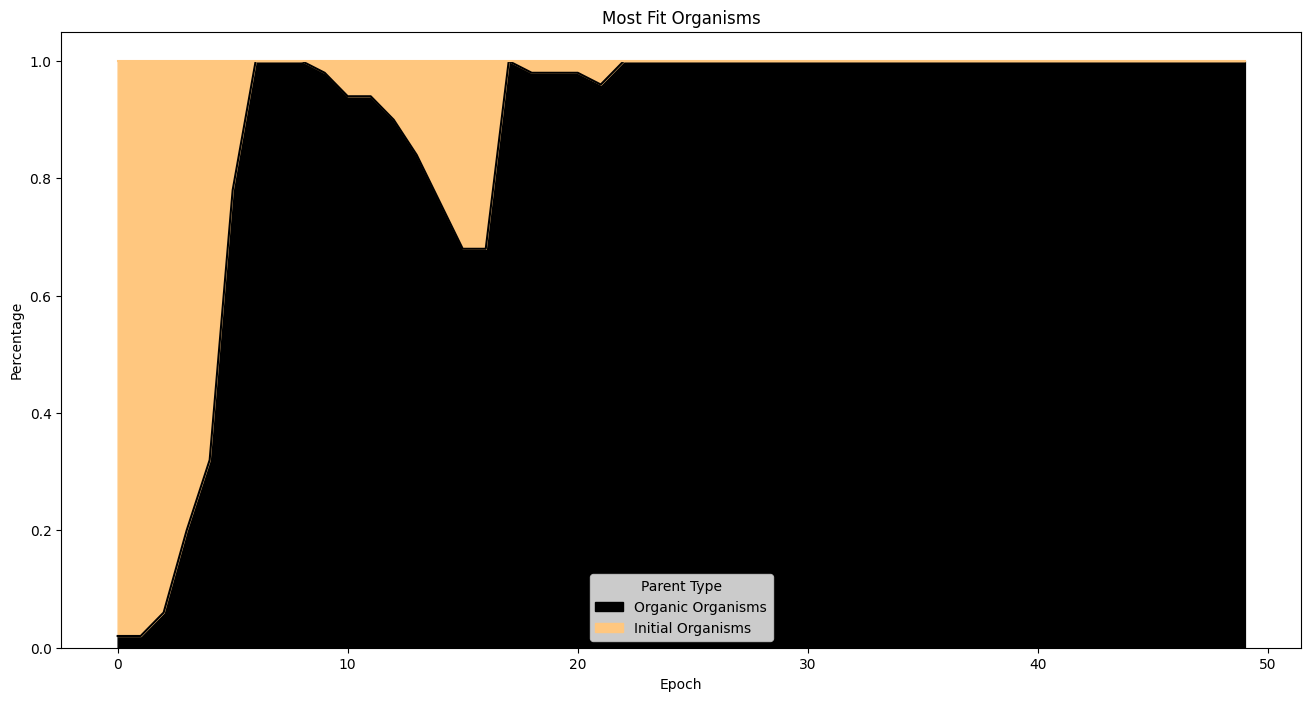
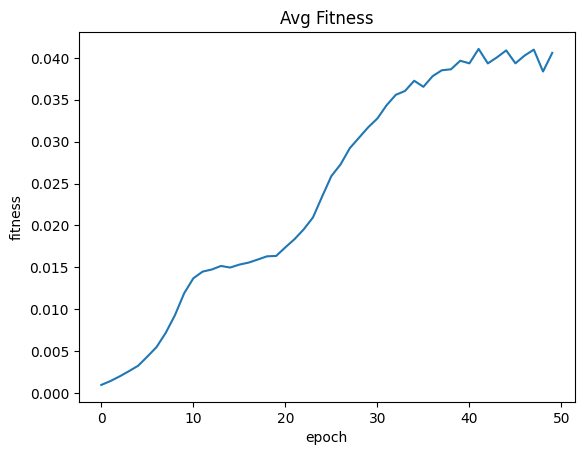
Organisms increase in size of time and start becoming tree like in structure near the final few epochs. The number of organic most fit organisms in the last 10 epochs makes me believe that fitness is still tending upwards.
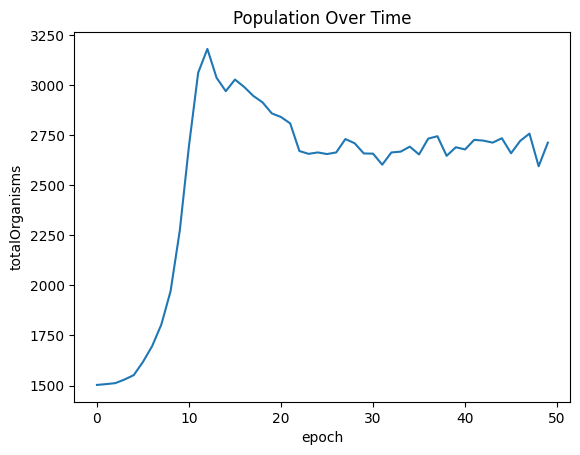
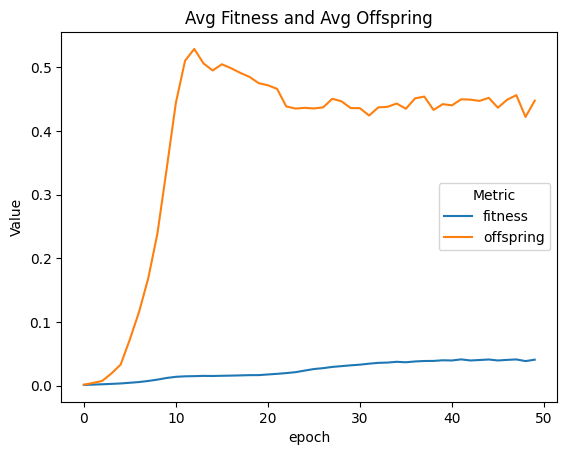
Population spikes before slightly declining. The cost of generating a seed has been increased from 10 to 150 energy units and there is a penalty for generating more than 2 seeds. As a result, I would expect the population to grow exponentally as more organisms seed, and then slowly decrease as the penalty in fitness to overseeding takes effect.
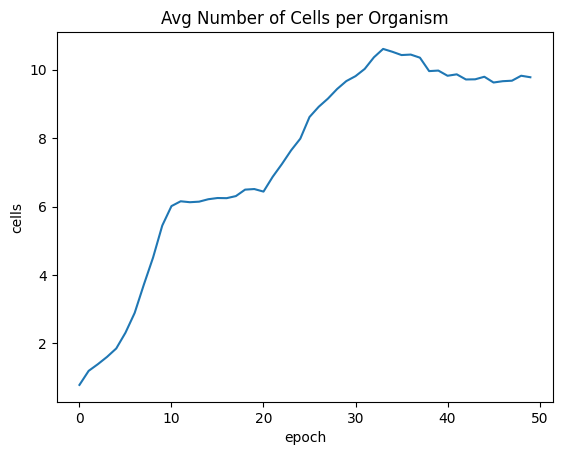
I’m disappointed the average number of cells per organism begins decreasing around epoch 30. I’m not sure why that is happening, but this may be an indication of a contrapositive relationship between two fitness factors. I’ll need to tweak the fitness function more.
Brown is roots, yellow is seeds, red is helicopter seed, dark green is brank and trunk, light green is leaves.
1
2
3
4
5
6
7
8
9
10
11
12
13
14
15
16
17
18
19
20
21
22
23
24
25
26
27
28
29
30
31
32
33
34
35
36
| import pandas as pd
import json
import seaborn as sns
import matplotlib.pyplot as plt
import math
import gzip
import os
def compareAvgMetricsByEpoch(dataframe, firstColumn, secondColumn ):
avgFirstColumnDf = dataframe.groupby('epoch', as_index=False)[firstColumn].mean()
avgSecondColumnDf = dataframe.groupby('epoch', as_index=False)[secondColumn].mean()
joinedData = pd.merge(avgFirstColumnDf, avgSecondColumnDf, on='epoch')
avgEpochOverlay = joinedData.melt(id_vars='epoch', var_name='Metric', value_name='Value')
return sns.lineplot(data=avgEpochOverlay, x='epoch', y='Value', hue='Metric')
def read_files_to_dataframe(basedirectory, metric):
dataframes = []
for directory in os.listdir(basedirectory):
if( directory != 'overview.json' ):
filepath = os.path.join(os.path.join(basedirectory, directory), metric + '.txt.gz')
with gzip.open(filepath, 'rb') as f:
df = pd.read_json(f,lines=True)
df['epoch'] = int(directory.rsplit('-', 1)[-1])
dataframes.append(df)
return pd.concat(dataframes, ignore_index=True)
def readPopulationOverTime(file):
raw_df = pd.read_json(file)
overview = pd.json_normalize(raw_df['worlds'])
overview['epoch'] = overview['name'].str.split('-', expand=True)[2].astype(int)
trimmed = pd.DataFrame(overview, columns=['epoch', 'totalOrganisms'])
return trimmed.iloc[::2]
|
Global Variable:
1
2
3
4
| INPUT_FILE_DIR = '/Users/luke/dev/analysis/data/sim8'
METRIC='Performance'
EXPANDED_FITNESS_MAGNIFICATION = { 'startIndex': 0, 'count': 50 }
|
Global Computed Variables:
1
2
| fullSimulationDataDf = read_files_to_dataframe( INPUT_FILE_DIR, METRIC)
populationOverTimeDf = fullSimulationDataDf.value_counts('epoch').reset_index(name='totalOrganisms')
|
Analysis:
1
| sns.lineplot(x="epoch", y="totalOrganisms", data=populationOverTimeDf ).set_title("Population Over Time")
|
1
| Text(0.5, 1.0, 'Population Over Time')
|
1
2
3
| mostFitByEpochDf = fullSimulationDataDf.groupby('epoch')['fitness'].max().reset_index()
plt.figure(figsize=(14, 8))
sns.lineplot(x="epoch", y="fitness", data=mostFitByEpochDf ).set_title("Most Fit Organism Fitness")
|
1
| Text(0.5, 1.0, 'Most Fit Organism Fitness')
|
1
2
| avgSizeByEpoch = fullSimulationDataDf.groupby('epoch', as_index=False)['cells'].mean()
sns.lineplot(x="epoch", y="cells", data=avgSizeByEpoch ).set_title("Avg Number of Cells per Organism")
|
1
| Text(0.5, 1.0, 'Avg Number of Cells per Organism')
|
1
2
3
4
5
6
7
8
9
10
11
12
13
14
15
16
17
18
19
20
21
22
23
24
25
26
27
| fitnessHeritage = (
fullSimulationDataDf.sort_values(by='fitness', ascending=False)
.groupby('epoch')
.head(50)
)
percentages = (
fitnessHeritage.assign(
isOrigOrganism =fitnessHeritage['parentId'].eq('GOD')
)
.groupby('epoch')['isOrigOrganism']
.value_counts(normalize=True)
.unstack(fill_value=0)
.rename(columns={True: 'Initial Organisms', False: 'Organic Organisms'})
)
percentages.plot(
kind='area',
stacked=True,
figsize=(16, 8),
colormap='copper',
title='Most Fit Organisms'
)
plt.ylabel('Percentage')
plt.xlabel('Epoch')
plt.legend(title='Parent Type')
plt.show()
|
1
2
| avgFitnessByEpoch = fullSimulationDataDf.groupby('epoch', as_index=False)['fitness'].mean()
sns.lineplot(x="epoch", y="fitness", data=avgFitnessByEpoch ).set_title("Avg Fitness")
|
1
| Text(0.5, 1.0, 'Avg Fitness')
|
1
2
| linePlt = compareAvgMetricsByEpoch(fullSimulationDataDf, 'fitness', 'offspring')
nothing = linePlt.set_title('Avg Fitness and Avg Offspring')
|
1
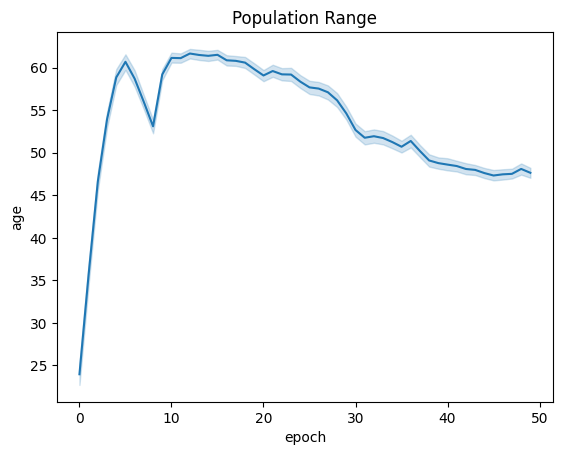
| linePlt = sns.lineplot(x="epoch", y="age", data=fullSimulationDataDf ).set_title("Population Range")
|
1
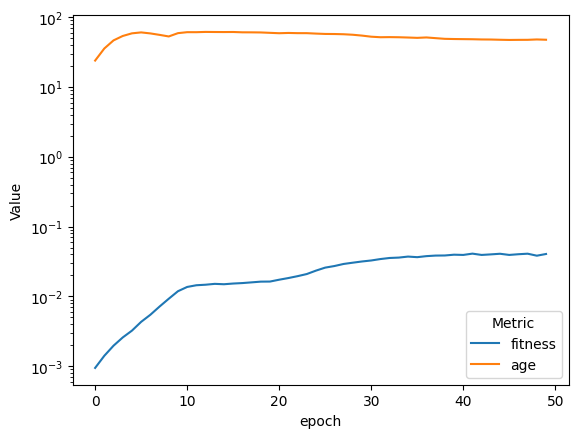
| compareAvgMetricsByEpoch(fullSimulationDataDf, 'fitness', 'age').set_yscale('log')
|